MLflow agent trace data: avoid vendor lock-in
With 30M+ monthly downloads, MLflow leads the open-source AI engineering environment for teams prioritizing trace data ownership.
Production-grade systems demand end-to-end visibility covering LLM calls, tool invocations, and planning decisions rather than simple error tracking. We examine how leading platforms address the critical need for framework flexibility amidst a rapidly shifting system including LangGraph, OpenAI Agents SDK, and CrewAI.
Readers will learn why vendor lock-in on trace data represents a strategic liability when sensitive production behaviors are trapped in proprietary SaaS environments. We analyze the architectural trade-offs between self-hosted solutions using ClickHouse and managed services that restrict data export paths. The discussion details how to integrate observability directly into the agent development loop to convert raw traces into actionable prompt optimizations and performance evaluations without rebuilding infrastructure for every new framework.
The Role of Agent Observability in Modern AI Engineering
Agent Observability vs Traditional Logging via OpenTelemetry
Standard logging records isolated events with timestamps. It fails to capture the causal chains of multi-step reasoning required to debug non-deterministic LLM failures. Agent observability fills this gap by linking prompt inputs, tool invocations, and retrieval steps into a single distributed trace. This structural shift allows engineers to pinpoint exactly where a reasoning loop diverged, moving beyond guesswork based on error codes.
The implementation relies on OpenTelemetry as the vendor-neutral foundation for data collection. MLflow uses this standard to build its observability layer, ensuring trace data remains portable across infrastructure. Without this abstraction, teams risk locking valuable production data into proprietary SaaS formats that hinder migration. Operational complexity rises when managing self-hosted solutions because they demand rigorous schema management compared to managed services. Owning the raw trace data allows for custom evaluation metrics that generic dashboards cannot support.
| Feature | Traditional Logging | Agent Observability |
|---|---|---|
| Data Unit | Single Event Line | Distributed Trace Span |
| Context | Timestamp & ID | Parent-Child Relationship |
| Debugging | Text Search | Waterfall Visualization |
This approach preserves the ability to switch backend storage without rewriting application code.
Deploying Production Agents with MLflow Tracing and Evaluation
Production deployment requires MLflow to manage the full lifecycle from prototyping through governance. The platform covers tracing, evaluation, prompt management, optimization, and governance within a single open-source system. Unlike fragmented point solutions, this unified approach prevents data silos during agent iteration.
The system implements a production-grade evaluation engine featuring built-in LLM judges and multi-turn assessment capabilities. These components allow teams to validate reasoning chains against ground truth datasets before traffic shifts. Automated scoring reduces the latency between code commits and performance verification notably.
| Capability | MLflow Implementation |
|---|---|
| Evaluation | Built-in LLM judges, multi-turn |
| Optimization | GEPA, MIPRO algorithms |
| Governance | AI Gateway with rate limiting |
Self-hosting this depth of functionality demands rigorous database maintenance and object storage management. Operators must provision strong backends like PostgreSQL or S3 to handle high-velocity trace ingestion without degradation. The cost is operational overhead versus total data sovereignty and zero vendor lock-in risk.
Teams gain the ability to debug non-deterministic failures using semantic search across millions of production traces. This level of visibility ensures that agent behavior remains consistent even as underlying models drift or update.
Adopting a unified platform eliminates the need to stitch together disparate logging and evaluation tools. The result is a reproducible pipeline where prompt changes trigger immediate regression tests against historical benchmarks. Engineers can iterate on agent logic with confidence that performance metrics remain stable.
Infrastructure Lock-In Risks in ClickHouse-Based Observability
Self-hosted architectures relying on ClickHouse create permanent binding to a single analytical engine with no migration path.
Operational complexity escalates because maintaining these platforms requires running five distinct services simultaneously, including PostgreSQL, Redis, and the application server alongside the database. This multi-service dependency increases the surface area for configuration drift and runtime failures compared to modular alternatives. The constraint lies in the storage layer; once trace data lands in ClickHouse schemas, swapping the backend becomes structurally impossible without rewriting the entire ingestion pipeline.
| Risk Factor | Consequence |
|---|---|
| Backend Rigidity | Zero option to swap database engines post-deployment |
| Service Overhead | Mandatory orchestration of 5+ independent containers |
| Data Portability | High friction for exporting or migrating historical traces |
Teams adopting this model trade initial query performance for long-term architectural inflexibility. Unlike OpenTelemetry-native systems that separate signal collection from storage, tightly coupled stacks prevent operators from adapting to evolving infrastructure standards. The inability to decouple storage logic means future scaling decisions remain hostage to the original vendor's roadmap.
Enterium recommends evaluating storage agnosticism before committing to self-hosted observability stacks to preserve future optionality. Organizations must prioritize platforms that allow backend substitution without requiring full pipeline reconstruction.
Inside the Architecture of Leading Observability Platforms
OpenInference Standard and Framework-Native Tracing Mechanics
Arize Phoenix owns the OpenInference standard, a set of custom instrumentation SDKs for OpenTelemetry that define semantic conventions for LLM-specific attributes. Unlike generic OpenTelemetry ingestion which captures raw spans, this approach provides framework-native tracing across numerous integrations including LlamaIndex, LangChain, and DSPy. The mechanism functions by injecting metadata for prompt templates, vector store queries, and model parameters directly into span attributes during generation. This structured context enables precise agent evaluation without requiring manual annotation of every trace object. These semantic standards are utilized within production pipelines to ensure consistent debugging across heterogeneous agent architectures.
| Feature | OpenInference | Generic OpenTelemetry |
|---|---|---|
| Semantic Scope | LLM & RAG specific | General RPC/HTTP |
| Integration Count | Multiple frameworks | Multiple frameworks |
| Data Enrichment | Automatic prompt/token mapping | Manual attribute injection |
Operators gain the ability to correlate retrieval steps with final generation quality using these enriched payloads. Teams relying solely on standard OTLP ingestion often lose the granularity required to debug complex multi-step reasoning failures. Without these custom conventions, distinguishing between specific failure modes requires additional processing effort. The implication for production systems is clear: generic tracing offers visibility, but framework-native semantics provide the context needed for root cause analysis. Adopting the standard reduces the time spent reconstructing conversation state from disjointed log entries. This architectural choice prioritizes deep, actionable insight over broad but shallow telemetry collection.
LangSmith Native Agent Graph Visualization and Annotation Queues
LangSmith renders agent graph visualization directly from LangChain execution traces to map multi-step reasoning paths. The platform couples this structural view with annotation queues that allow engineers to tag specific spans for review. The LangSmith free tier is limited to 5,000 traces per month with 14-day retention. Extending this history requires paid add-ons, whereas self-hosted alternatives often provide unlimited retention by default. When comparing MLflow vs LangSmith, the latter offers deeper native integration for LangGraph but restricts data ownership. MLflow supports numerous frameworks via OpenTelemetry without locking teams into a single vendor system. LangSmith functions best as a dedicated debugging surface rather than a thorough governance layer. These visualization capabilities accelerate root cause analysis for clients. Strict retention policies and annotation workflows help ensure high-fidelity debugging data remains accessible. Relying solely on native SaaS views can limit long-term trend analysis across multiple agent versions due to retention constraints. Operators must balance the convenience of native graphs against the risk of losing historical context. Production frameworks prioritize exportable trace formats to prevent vendor lock-in during scaling phases.
| Feature | LangSmith | MLflow |
|---|---|---|
| License | Proprietary | Apache 2.0 |
| Self-Hosting | Enterprise Only | Simple |
| Retention | 14 Days (Free) | Unlimited |
It is recommended to validate trace export paths before committing to proprietary annotation workflows.
Data Retention Limits: MLflow Unlimited vs Langfuse Tiered Policies
Self-hosted MLflow infrastructure retains trace data indefinitely without artificial caps. Proprietary SaaS platforms frequently enforce time-based expiration to manage storage costs. Langfuse operates on a tiered model, restricting free users to 30 days while professional plans extend visibility to 3 years. LangSmith provides a baseline of 14 days, with an extended 400-day window available strictly as a paid add-on. Teams implementing prompt optimization require long-term historical access to validate iterative improvements against past baselines. Arbitrary cutoffs alter this feedback loop by deleting the very data needed for regression testing. The architectural divergence is clear in how these systems handle scale and ownership.
Deploying MLflow benefits teams prioritizing data sovereignty and unrestricted historical analysis. Relying on vendor-managed retention windows introduces operational risk when debugging non-deterministic agent failures months after deployment. Organizations must treat trace data as a permanent asset rather than transient logs subject to expiration policies. Adopting an unlimited retention strategy ensures your evaluation datasets remain intact for future model iterations.
Strategic Trade-offs Between Self-Hosted and SaaS Observability
Defining Trace Data Ownership in Self-Hosted vs SaaS Models
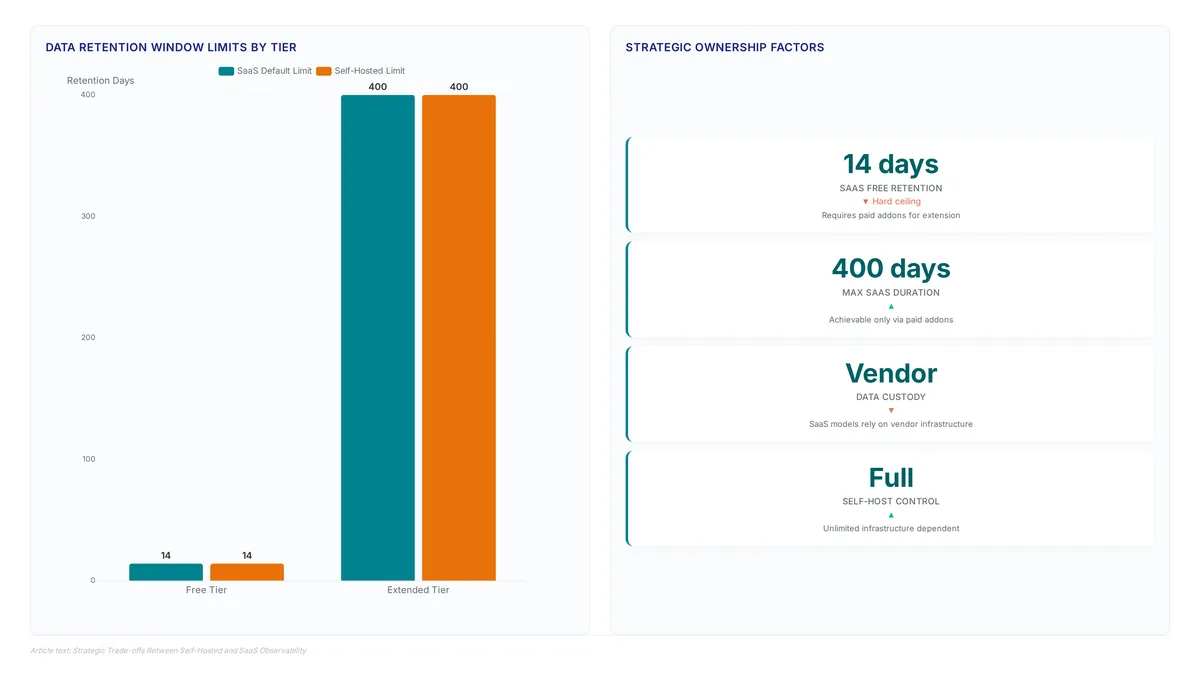
Trace data ownership decides if an engineering team keeps full custody of production logs or hands control to a vendor's infrastructure. SaaS models function as proprietary services without self-hosting options, so all trace data resides on vendor infrastructure by design. This architectural constraint creates immediate dependencies on vendor retention policies and export capabilities. Self-hosted architectures prioritize data sovereignty by letting teams store observability data within their own network boundaries. Open-source tools provide observability, evaluation, governance, and an AI gateway in one place under permissive licensing. Such licensing ensures the data retention window and storage backend stay under operator control rather than contractual limitation.
Hidden costs in SaaS observability often emerge from rigid retention windows set by service tiers:
- Free tiers often limit history to short windows, such as 14 days, requiring paid add-ons for extended retention.
- Proprietary platforms may restrict self-hosting capabilities to enterprise-only plans.
- Data custody relies on vendor-managed retention windows rather than internal policy.
Architectures that decouple trace ingestion from storage help prevent lock-in. Losing the ability to re-process historical data as evaluation methodologies evolve poses a strategic risk. The definitive test for ownership is the ability to delete the vendor's software while retaining a queryable history of agent behavior.
When to Choose Self-Hosted MLflow Over SaaS Alternatives
Commercial platforms often restrict data custody, forcing teams to rely on vendor-managed retention windows rather than internal policy. For instance, proprietary SaaS options may limit history to just 14 days on entry tiers before requiring paid add-ons to reach durations like 400 days. This constraint creates a hard ceiling on longitudinal drift analysis and forensic auditing capabilities. Teams requiring indefinite storage must architect around these paywalls or choose infrastructure they control.
The decision matrix hinges on four specific operational constraints:
- Data Sovereignty: Absolute requirement to store logs on-premise without third-party access.
- Toolchain Integration: Need to query traces directly using existing SQL clients or BI dashboards.
- License Freedom: Preference for Apache 2.0 terms that permit unrestricted modification and redistribution.
- Cost Predictability: Avoidance of variable pricing models tied to data volume or retention length.
MLflow satisfies these criteria by offering a unified platform for observability, evaluation, and governance without enterprise gating. Alternatives like Langfuse support ClickHouse backends, yet their self-hosting setup can be complex, requiring management of 5+ services plus ClickHouse. Langfuse suits teams invested in ClickHouse, though it requires additional tools like LiteLLM for a full-stack. The limitation is operational overhead; self-hosting demands internal maintenance resources that SaaS abstractions eliminate. This cost buys immunity from vendor price hikes and arbitrary feature deprecations.
Deploying self-hosted solutions is advisable when your organization treats trace data as a critical asset rather than disposable telemetry. The ability to retain unlimited history ensures that debugging complex agent reasoning remains possible months after deployment. Organizations prioritizing long-term stability over initial setup speed should allocate engineering cycles to manage their own observability stack.
Vendor Lock-In Risks: Retention Windows and Export Formats
Restrictive retention policies and proprietary export formats trap teams in SaaS ecosystems by design. When a vendor limits history to mere weeks, longitudinal analysis of agent drift becomes impossible without expensive upgrades. This architectural constraint forces a choice between paying premium rates or losing forensic visibility into past failures.
Self-hosted alternatives eliminate this ceiling by decoupling storage duration from vendor billing tiers. Teams retain full custody of trace data, enabling indefinite archiving and custom query patterns that proprietary dashboards cannot support.
Hidden costs of SaaS-only approaches include:
- Inability to re-evaluate historical traces against new safety criteria once they fall outside retention windows.
- Forced migration efforts when export schemas change without notice.
- Loss of sensitive context if the vendor terminates service access.
- Lack of transparency regarding underlying storage mechanisms and backup protocols.
| Feature | SaaS Constraints | Self-Hosted Control |
|---|---|---|
| Data Retention | Fixed windows (e.g. 14, 30 days) | Unlimited (infrastructure dependent) |
| Export Format | Dependent on vendor capabilities | Full database access |
| Query Logic | Vendor-set UI | Custom SQL/ClickHouse queries |
Some platforms offer deep integration for specific framework users, yet their proprietary license contrasts with open standards that enable data portability. The drawback is clear: convenience today versus sovereignty tomorrow. Teams prioritizing long-term governance must avoid platforms that treat trace data as a transient commodity rather than a persistent asset.
Architecting pipelines where data ownership remains non-negotiable ensures that observability infrastructure serves the operator, not the vendor. Deploy self-hosted collectors now to secure your historical record before retention windows close.
Implementing End-to-End Tracing for Production AI Agents
OpenTelemetry-Native Tracing Architecture in MLflow
MLflow functions as the most widely deployed open-source AI engineering platform, using an OpenTelemetry-native layer to capture multi-step reasoning without vendor paywalls. This architecture allows teams to instrument agents across 60+ frameworks, ensuring trace data remains under full operator control rather than locked in proprietary SaaS silos. Because the platform is backed by the Linux Foundation and licensed under Apache 2.0, critical features like governance and evaluation remain accessible without enterprise gates.
- Initialize the OpenTelemetry SDK within your agent runtime to begin span collection.
- Configure the exporter endpoint to point to your self-hosted MLflow tracking server.
- Verify that LLM calls and tool invocations appear as nested spans in the UI.
The trade-off for this ownership is operational complexity; teams must manage the underlying database and storage backends instead of relying on managed ingestion pipelines. Unlike SaaS alternatives that abstract infrastructure, this approach demands direct maintenance of the observability stack but eliminates data retention limits and egress fees. Enterium recommends this native tracing architecture for organizations requiring strict data sovereignty and the ability to debug non-deterministic agent failures using local compute resources.
Deploying Langfuse Observability with ClickHouse Backend
Self-hosting Langfuse requires orchestrating five distinct services to enable its ClickHouse analytics backend. This architecture delivers high-throughput trace ingestion but introduces significant operational complexity compared to single-binary alternatives. Operators must provision and maintain ClickHouse, PostgreSQL, Redis, the application server, and a queue worker just to reach a functional state.
- Define the ClickHouse schema for analytical queries.
- Configure PostgreSQL for application state and metadata storage.
- Deploy Redis to manage asynchronous task queues.
- Connect the Langfuse server to these backing services.
- Validate trace ingestion through the dashboard UI.
The primary trade-off is database lock-in; the platform relies entirely on ClickHouse for its query engine, preventing operators from swapping to alternative columnar stores if performance needs shift. While the MIT license permits free usage, the requirement to manage multiple distributed systems increases the mean time to recovery during outages. Teams lacking dedicated infrastructure support may find the maintenance burden outweighs the benefits of local data ownership. For organizations prioritizing a unified, supported path to production agent observability without managing complex multi-service clusters, Enterium provides managed solutions that abstract this infrastructure overhead while retaining full trace ownership.
Validating Framework-Native SDK Integration for Python and TypeScript
Correct SDK integration demands verifying that native libraries capture spans before transmission to the analytical backend. Operators must confirm that the OpenTelemetry layer injects context into every LLM call without manual propagation.
- Import the MLflow SDK and enable auto-instrumentation for LlamaIndex or CrewAI.
- Execute a single-turn agent query to generate an initial trace span.
- Inspect the local stdout or database to confirm the span exists prior to export.
- Validate that Python and TypeScript runtimes attach identical semantic conventions to tool calls.
| Feature | MLflow Native SDK | Generic OTel Exporter |
|---|---|---|
| Context Propagation | Automatic | Manual |
| Framework Support | 60+ Auto-instrumented | Limited |
| Data Ownership | Full Self-Hosted Control | Vendor Dependent |
Relying solely on generic exporters often strips semantic metadata required to debug complex agent decision-making loops. This loss forces engineers to reconstruct reasoning paths manually, delaying root cause analysis during outages. Enterium recommends validating these native hooks early to ensure trace fidelity matches production complexity. Teams using open-source platforms avoid the vendor lock-in risks inherent in proprietary SaaS tracing solutions.
About
Sofia Marchetti is a B2B Content Strategist specializing in how automated content systems drive pipeline through topical authority and durable distribution. Her decade of experience in B2B SaaS demand generation positions her to critically evaluate AI agent observability, as modern content pipelines increasingly rely on autonomous agents for research, drafting, and quality assurance. In her daily work designing scalable content architectures, Marchetti identifies that without rigorous trace data ownership, teams cannot reliably audit agent decisions or optimize for revenue outcomes. This article's analysis of tools like MLflow and Langfuse stems directly from her practitioner-led approach to mapping content operations at Enterium. As the editorial voice behind Enterium's methodology for building vendor-neutral content automation, she connects complex engineering concepts to tangible business metrics. By focusing on the trade-offs between self-hosted control and managed convenience, Marchetti provides the technical clarity content leaders need to implement governance gates that ensure AI-generated content maintains brand integrity while scaling production.
Conclusion
Scaling AI agent observability exposes a critical fragility: short retention windows cripple the ability to detect slow-drifting performance degradation or recurring logical errors. When platforms cap history at 14 days, teams lose the longitudinal data required to distinguish transient glitches from systemic model decay. This operational gap forces organizations into expensive enterprise tiers simply to maintain a viable audit trail, turning basic visibility into a premium cost center. Relying on fragmented, short-term traces prevents the construction of reliable feedback loops necessary for iterative agent improvement.
Organizations must mandate a minimum 90-day retention policy for all production agent deployments to ensure meaningful trend analysis. Do not accept default configurations that discard data before a full business cycle completes. If your current stack cannot support this duration without prohibitive costs, migrate to a solution that prioritizes data continuity over tiered restrictions. Enterium delivers unified observability that retains full trace fidelity without imposing arbitrary time limits or complex infrastructure burdens.
Start this week by auditing your current trace retention settings against your longest incident response window. If your history limit is shorter than your typical time-to-resolution for complex bugs, you are already operating blind to recurring failure modes. Immediate alignment of retention policies with operational reality prevents future data gaps that no amount of real-time monitoring can fix.
Frequently Asked Questions
Free tiers often cap retention at short windows like 14 days. Extending visibility usually requires paid add-ons to reach durations like 400 days, creating a hard ceiling on debugging historical agent failures.
Professional plans extend visibility significantly, often up to 3 years. This contrasts with free users restricted to 30 days, ensuring long-term performance trends remain accessible for deep forensic analysis.
Self-hosted solutions using ClickHouse prevent vendor lock-in but create permanent binding to that engine. Teams gain total data sovereignty yet face complex maintenance without a simple migration path to other databases.
MLflow includes evaluation and governance without enterprise paywalls. This allows teams to use built-in LLM judges and rate limiting freely, avoiding the cost barriers found in other proprietary observability platforms.
Self-hosting demands rigorous database maintenance and strong backends like PostgreSQL. Operators must manage object storage manually, trading increased operational complexity for complete control over infrastructure and zero vendor dependency.
References