AI content performance: Stop counting volume
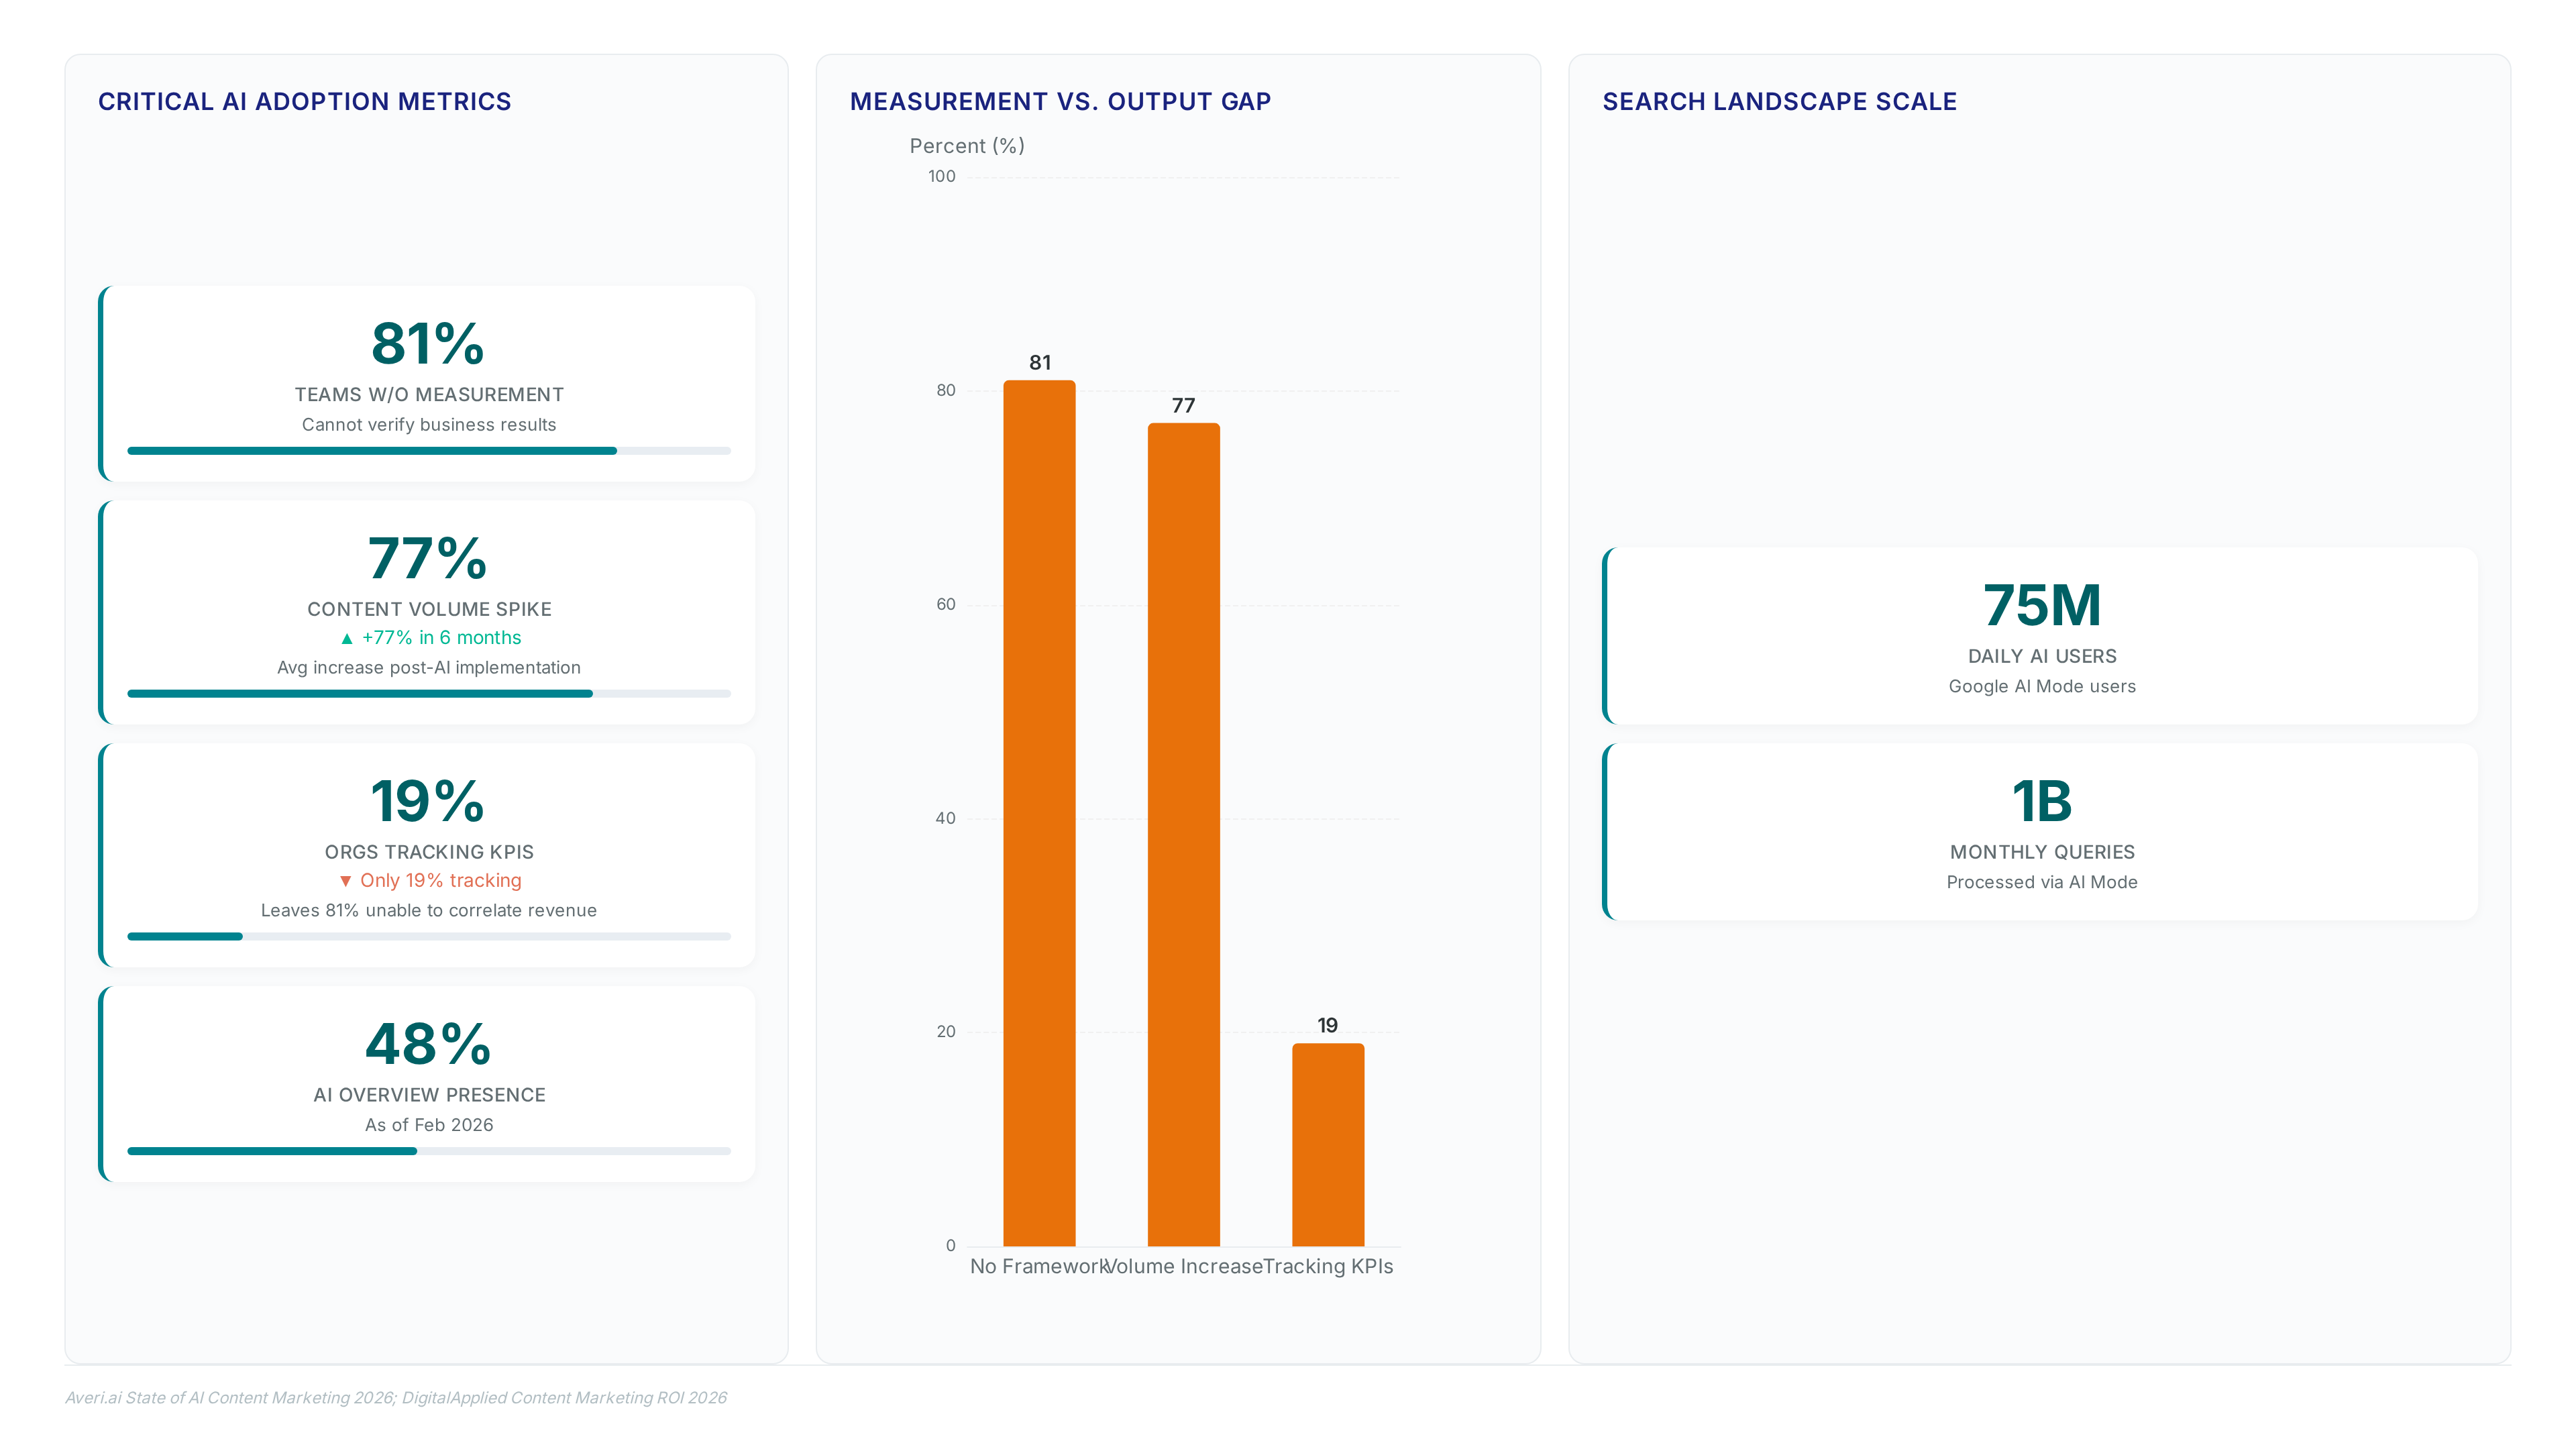
With 81% of content teams lacking a framework to verify business results, measuring AI content performance requires shifting focus from output volume to actual impact.
Tracking production speed or asset count does not prove effectiveness; it often masks brand erosion. True performance measurement demands connecting every AI-assisted asset to specific goals across visibility, engagement, and revenue layers. This guide details how to define outcome-based metrics for different content types, implement channel-specific KPI tracking with proper UTM parameters, and build a performance scorecard for running controlled experiments.
We separate the stack into three layers: output metrics (time-to-publish), content metrics (watch time), and business outcomes (CAC, retention). Publishing 30 AI blogs means nothing without defining "good" for each format, be it add-to-cart rates for product descriptions or click-through rates for video. By establishing clear goals, audiences, and time windows, teams move beyond guessing. Tools like Gen AI Last allow testing variations against hard data, ensuring strategy drives leads and pipeline growth rather than just inflating content volume.
Defining AI Content Performance Through Outcome-Based Metrics
Defining AI Content Productivity as Measurable Business Impact
AI content output defines the measurable impact of AI-assisted assets on business goals. This definition explicitly excludes raw output volume, a figure that rose notably within the first six months of implementing AI tools yet often fails to correlate with actual success. Teams measuring only production speed miss whether assets drive revenue or damage brand trust. True evaluation requires distinguishing between output metrics like cost per asset and business metrics such as pipeline growth or support deflection. Without this distinction, a large majority of content teams operate without a framework to determine if AI generates results or merely noise.
The mechanism demands a four-part specification: the goal, the audience, the distribution channel, and the metric proving success. Operators must track engaged sessions rather than simple page views to verify user intent alignment. Scaling generation velocity often conflicts with the factuality required for regulatory compliance. High-volume outputs frequently lack the entity clarity needed for AI search extraction, rendering them invisible to modern discovery engines.
| Metric Layer | Examples | Business Value |
|---|---|---|
| Output | Volume, Speed | Efficiency baseline |
| Content | Clicks, Shares | Audience resonance |
| Business | Revenue, Retention | Strategic impact |
Focusing solely on volume creates a false economy where increased production dilutes overall value. Implementing strong tagging infrastructure (UTMs) and analytics agents connects systems to reveal these insights, representing a shift from free manual tracking to paid or integrated intelligence platforms. Shift tracking priorities from quantity to qualified outcomes today.
Applying Outcome-Based Metrics Over Volume Signals
Applying outcome-based metrics requires replacing raw output counts with revenue-linked KPIs that validate asset effectiveness. Teams must stop tracking blog post counts and start measuring citation rate, which gauges how often platforms reference content as an authoritative source. Production volume no longer correlates with business success in generative search environments.
| Metric Layer | Old Signal (Volume) | New Signal (Outcome) |
|---|---|---|
| Primary | Posts published | Revenue attributed |
| Secondary | Page views | Lead conversion rate |
| Tertiary | Social shares | Citation frequency |
Operators implement this by tagging every asset with UTM parameters to trace visibility back to pipeline growth. The citation rate now serves as a primary indicator of trustworthiness, superseding traditional domain authority scores. Without this granularity, organizations cannot distinguish between high-velocity noise and high-value assets.
Speed of deployment often clashes with depth of attribution. Rapid iteration frequently bypasses the tagging infrastructure required for accurate revenue attribution. If the tracking layer is incomplete, the resulting data misleads strategy rather than informing it. Teams risk optimizing for false positives where content appears successful due to missing context.
Establishing a performance scorecard that prioritizes business metrics forces a discipline where evaluation focuses on downstream traffic and conversions. This approach mitigates the risk of compounding waste on assets that generate traffic but zero profit. Practitioners must define the specific metric proving success before any generative task begins.
Output vs Outcome: Contrasting Volume Metrics with Revenue Goals
Output metrics track production speed, whereas outcome metrics validate revenue impact and business goal alignment. As of February 2026, AI Overviews appear on a significant share of all search queries, fundamentally altering how content visibility is measured compared to traditional organic results. Traditional signals like page views become insufficient for measuring true market presence in this environment. Operators must shift focus from counting assets to evaluating extractability and citation frequency, which now serve as primary indicators of authority.
| Metric Class | Measurement Focus | Business Risk |
|---|---|---|
| Output | Volume, speed, cost per asset | High production of low-value noise |
| Outcome | Leads, trials, revenue, retention | Misattribution of growth drivers |
| Hybrid | Views, clicks, saves | False confidence in engagement |
The transition cost involves deploying new tool stacks that attribute revenue to specific generated assets rather than aggregating channel totals. Maximizing generation speed often degrades the factuality required for high citation rates, forcing a choice between scale and trust. Teams ignoring this constraint face increased governance costs to remediate compliance failures introduced by unchecked automated drafting. Measurement frameworks must therefore prioritize brand trust over raw throughput to prevent reputation erosion. Without distinguishing between a published draft and a converted lead, organizations cannot optimize their AI investments effectively. The operational imperative is clear: move from measuring "output" to measuring "outcomes" using tool stacks capable of attributing revenue to specific AI-generated assets.
Mechanics of Channel-Specific KPI Tracking and UTM Implementation
Defining Channel-Specific KPIs for AI Text and Video Formats
Separating AI text performance from AI video performance demands distinct analytical lenses. Text assets depend on Google Search Console data points like impressions, average position, and organic CTR to validate visibility. Operators track engaged sessions and scroll depth to confirm readers consume the full argument. AI social copy performance prioritizes the hook rate, measuring 3-second views to determine if the asset stops the scroll.
| Feature | AI Text (SEO/Blog) | AI Video (Social/Reels) |
|---|---|---|
| Primary Signal | Organic Clicks | 3-Second Views |
| Quality Gate | Scroll Depth | Audience Retention Curve |
| Conversion | Form Submission | Link Sticker Click |
| Attribution | UTM Campaign | UTM Content ID |
Video success depends on the audience retention curve rather than total play counts. A sharp drop in the first five seconds indicates a failed hook, regardless of production quality. Teams often neglect utm_content parameters, rendering it impossible to attribute which specific script variation drove the conversion. Optimization creates friction; improving click-through rates on text often requires clickbait titles that degrade lead quality, whereas video optimization for watch time can sacrifice call-to-action clarity. Enterium recommends assigning a unique content ID to every asset to connect specific prompts to downstream revenue. Operators cannot distinguish between high-volume noise and genuine business impact without isolating these variables.
Implementing UTM Naming Conventions for AI Variation Tracking
Correct attribution of AI content throughput requires embedding utm_content parameters to isolate specific model outputs within analytics streams. Operators structure the naming convention so utm_source identifies the platform, utm_medium defines the format, and utm_campaign tracks the initiative, leaving utm_content exclusively for version IDs like ai_v1_hookA. This specific parameter becomes the sole location to attribute performance to a distinct AI variation, separating it from human-created assets or alternative prompts. Data aggregation masks which specific generative iteration drove the conversion without this granularity.
The implementation workflow demands four precise actions to fix inconsistent tracking:
- Assign a unique content ID to every asset before publication.
- Append the full UTM string to every distribution link.
- Define conversion events in GA4 that match business models, such as
book_demoorpurchase. - Connect analytics agents to systems like Google Analytics for automated intelligence.
A critical limitation arises when teams neglect the version ID discipline; without unique identifiers for every headline or script variation, A/B testing yields inconclusive results because the input signal remains ambiguous. The cost of this ambiguity is the inability to prune underperforming models, leading to wasted compute resources on low-yield variants. Inconsistent tagging prevents the correlation of specific prompt engineering strategies with revenue outcomes.
| Parameter | Function | Example Value |
|---|---|---|
utm_source |
Platform identification | linkedin, newsletter |
utm_medium |
Format classification | social, email, organic |
utm_campaign |
Initiative tracking | q2_leadgen, launch |
utm_content |
Version isolation | ai_v2_creativeB |
Operators at Enterium should mandate that no AI-generated link goes live without the version ID populated in the utm_content field. This discipline transforms raw traffic data into actionable intelligence regarding model efficacy.
Validating Conversion Events and Lead Quality Indicators in GA4
Mapping conversion events directly to business logic prevents optimization drift toward low-value actions. GA4 configurations must define specific triggers like sign_up, purchase, or book_demo that align with revenue generation rather than generic engagement. Algorithms maximize volume while ignoring value without this precision, a pattern observed when teams track mere form fills instead of qualified outcomes. B2B operators specifically require lead quality indicators such as meeting booked or opportunity created to filter noise from signal. Relying on shallow metrics creates a false positive rate where traffic increases but revenue stagnates.
The validation workflow requires four distinct verification steps:
- Audit existing GA4 events against the current sales model to identify gaps.
- Implement custom parameters that capture lead status changes like SQL designation.
- Cross-reference conversion data with CRM records to ensure fidelity.
- Exclude low-intent actions from primary bid strategies until quality thresholds are met.
| Event Type | Business Value | Risk if Unchecked |
|---|---|---|
| Form Submit | Low | High volume of spam |
| Demo Request | Medium | Unqualified leads |
| SQL Created | High | Missed revenue focus |
Enterium recommends treating event definitions as flexible code that evolves with sales cycles. A rigid tracking schema fails when product offerings shift, leaving analytics disconnected from reality. The constraint here is financial; wasted ad spend accumulates on audiences that convert technically but financially underperform.
Building a Performance Scorecard and Running Controlled Experiments
Structuring a One-Page Weekly Scorecard to Prevent Vanity Metric Drift

Condensing performance data onto a single page forces operators to discard volume metrics that no longer correlate with business success. When output rises notably, tracking every available signal creates noise that masks actual revenue drivers. The architecture requires six distinct categories to capture the full lifecycle of content value. Awareness tracks impressions and reach, while Engagement measures saves, shares, and email click-through rates. Conversion focuses on trial starts and purchases, whereas Value calculates revenue and pipeline influence. Efficiency monitors cost per asset and time-to-publish, and Quality captures refunds, complaints, and fact-check failures.
| Category | Primary Metric Focus | Risk Mitigated |
|---|---|---|
| Awareness | Impressions, Reach | Zero-click search visibility loss |
| Engagement | Saves, Shares, CTR | Superficial interaction without intent |
| Conversion | Trials, Purchases | High traffic with no revenue lift |
| Value | Revenue, Pipeline | Misattribution of growth sources |
| Efficiency | Cost, Time-to-Publish | Resource waste on low-yield assets |
| Quality | Complaints, Fact-checks | Brand damage from hallucinations |
Limiting the dashboard prevents teams from celebrating high production rates while ignoring downstream traffic stagnation. If the scorecard expands beyond one page, operators inevitably drift toward counting assets rather than validating outcomes. This structural constraint ensures that rising output volumes do not hide declining marginal returns. Compliance issues often surface first in the Quality column, acting as an early warning system before legal exposure grows. Without this focused view, organizations risk optimizing for speed while their brand trust erodes silently.
Executing a 30-Day Cycle for AI Asset Variant Testing
Establishing a human-created control group isolates seasonality variables from genuine model lift. Without this baseline, operators cannot distinguish between budget fluctuations and actual asset performance improvements. The architecture requires holding out legacy content to serve as the statistical anchor for all comparative analysis. This approach prevents false attribution where external market shifts masquerade as generative success.
The workflow spans a 30-day cycle divided into four distinct operational phases. Week 1 establishes baselines for ten to twenty assets while selecting a single primary KPI. Week 2 uses Gen AI Last to produce two to five variations per concept for testing. Week 3 involves analyzing early signals to cut underperforming paid variants immediately. Week 4 documents winning patterns to refine future prompt engineering strategies.
| Phase | Action Item | Outcome |
|---|---|---|
| Week 1 | Record baseline KPIs | Set control metrics |
| Week 2 | Generate variants | 2, 5 AI assets ready |
| Week 3 | Analyze signals | Losers identified |
| Week 4 | Report outcomes | Validated templates |
Iteration speed often conflicts with statistical significance when sample sizes are small. Rapid deployment tempts teams to declare winners before data matures, leading to premature optimization. Teams must resist closing experiments early even when early lift appears obvious to the naked eye.
Consistent tagging via utm_content parameters ensures attribution remains accurate across all tested versions. This technical requirement allows operators to track exactly which variation drove specific revenue events. Failure to implement this granularity renders the entire experiment invisible to analytics platforms. The cost of poor tagging is total data ambiguity regarding asset value.
Enterium recommends focusing strictly on conversion rate lift rather than raw volume increases. Measuring CPA reduction provides a clearer signal of efficiency than simple impression counts ever could. Operators should prioritize revenue per visitor improvements over superficial engagement metrics.
Validating Experiment Integrity Through Single-Variable Isolation
Isolating a single variable like headline, CTA, or style prevents confounding factors from corrupting performance data. Testing multiple elements simultaneously obscures the specific driver of conversion rate lift or CPA reduction. Operators must restrict each trial to one change to accurately attribute revenue per visitor improvements. This disciplined approach reveals whether a specific prompt adjustment drives value or merely adds noise to the dataset.
The validation checklist requires four strict gates before declaring a winner.
- Confirm the test group varies only one parameter against the control.
- Verify the sample size exceeds the statistical significance threshold for the channel.
- Ensure external budget shifts did not influence the observation window.
- Document the winning pattern as a reusable template for future Gen AI Last prompts.
Failure to isolate variables leads to incorrect assumptions about what connects with the audience. Real-time optimization loops allow teams to iterate based on immediate feedback that manual processes cannot match real-time feedback. However, rapid iteration without single-variable control creates a false sense of progress while masking actual degradation in content quality. The cost of this ambiguity is wasted spend on ineffective creative directions.
Enterium recommends logging every validated pattern into a central repository during Week 4 of the cycle. This archive transforms isolated experimental wins into scalable system knowledge. Without this documentation step, teams repeatedly solve the same problems, losing the compounding efficiency gains that generative tools promise.
Diagnosing Low Conversion Rates and Strategic Content Decisions
Defining Low AI Conversion Through Qualitative Accuracy Failures
Counting published blogs tells nobody if the content works or actively harms brand perception. Generative models sometimes hallucinate facts, destroying the entity clarity modern search systems need to trust and cite material effectively. This accuracy gap creates a specific failure mode where traffic arrives but users bounce immediately due to incorrect specifications or outdated claims. Organizations risk optimizing for volume while silently degrading brand trust if they skip factuality verification. Inconsistent attribution frameworks often prevent operators from correlating AI content efforts with revenue outcomes. A page might rank well yet fail to convert because the information lacks necessary clarity. Addressing this requires shifting focus from output speed to factuality checks that verify every claim. Unverified AI output functions as a liability rather than an asset. The solution involves enriching automated drafts with specific case examples and verified data points. High factuality serves as a key metric for compliance, legal, and governance teams to avoid reputational damage.
Applying Control Groups to Isolate AI Content Lift in Product Descriptions
Comparing AI versus human content requires a control group and measuring lift in the primary KPI. Operators cannot distinguish between seasonal budget fluctuations and genuine model performance improvements without holding out legacy descriptions as a statistical baseline. Teams must track the utm_content parameter to attribute revenue specifically to the AI-generated variation rather than the broader campaign. This granular tracking reveals whether the generative asset drives results or merely adds noise to the dataset. Relying solely on quantitative lift ignores hidden costs associated with factuality issues that erode brand trust over time.
- Accuracy sampling costs for verifying product specifications.
- Increased refund rates due to unclear sizing or feature claims.
- Governance overhead required to maintain brand voice consistency.
- Legal review cycles for high-risk claims.
Pairing quantitative A/B testing with qualitative reviews helps catch these failure modes early. Output volume often increases rapidly, yet the cost of failure rises when governance layers are skipped. A key limitation is that only 19% of organizations are currently tracking AI-specific KPIs, leaving most unable to correlate content efforts with revenue. Operators must validate that conversion rate improvement does not come at the expense of long-term customer retention or support ticket volume.
Risk of Premature Optimization and Mixed Variable Testing in AI Campaigns
Judging SEO too early represents a common error since rankings need weeks or months to stabilize. SEO requires 8, 12 weeks for meaningful ranking movement, making early optimization risky. This premature optimization cycle wastes resources and obscures the actual conversion baseline needed for accurate comparison. Data becomes useless when headline, image, and offer change in a single iteration because the resulting numbers cannot identify which element drove the conversion drop or lift.
- Confounding variables prevent isolation of the specific driver behind engagement shifts.
- Inability to replicate success occurs because the winning combination remains unknown.
- Governance costs rise as teams deploy expensive fixes for problems that were merely measurement artifacts.
- Strategic paralysis sets in when data points to conflicting conclusions.
Traditional metrics like bounce rate are insufficient when mixed variable testing hides the root cause of failure. Performance data becomes unusable for strategic decision-making without this discipline. The cost of failure increases notably when AI-generated content introduces factuality risks that require costly governance layers to fix post-publication.
About
Daniel Reyes serves as Head of Content Engineering at Enterium, where he architects production-grade AI content pipelines from ingestion to publication. His decade of experience in data and ML platform engineering provides the technical rigor necessary to dissect AI content efficiency beyond surface-level metrics. Unlike theoretical strategists, Reyes daily implements the very quality gates and evaluation harnesses discussed in this guide, ensuring that generated assets meet strict reliability standards before reaching audiences. At Enterium, a B2B publication dedicated to vendor-neutral content automation methodologies, he translates complex pipeline architecture into actionable insights for marketing operations teams. This article reflects his practitioner-to-practitioner approach, connecting raw generation outputs to tangible business outcomes like revenue and retention. By using his background in RAG systems and orchestration, Reyes offers a measurement framework grounded in real-world trade-offs rather than hype, enabling content leaders to build reproducible workflows that prove ROI with concrete data.
Conclusion
Scaling AI content production breaks when governance layers are bypassed to chase volume, creating a hidden operational debt that compounds with every untracked asset. The real cost is not the generation tool but the expensive remediation required to fix factuality errors and brand misalignment after publication. Without isolating variables, teams cannot distinguish between a winning headline and a lucky fluctuation, rendering their data useless for future strategy. This ambiguity forces organizations to rely on intuition rather than evidence, effectively guessing at scale while burning budget on confounded tests.
Teams must implement a strict single-variable testing protocol immediately, refusing to judge SEO performance before the 8, 12 week stabilization window. Do not attempt to optimize campaigns where headlines, images, and offers change simultaneously, as this guarantees strategic paralysis. Start by auditing your current testing logs this week to identify any iterations where multiple elements were altered at once. Flag these datasets as invalid and exclude them from your revenue correlation models to prevent skewing future forecasts.
True performance measurement requires pausing the rush to publish and establishing a baseline where only one factor changes per cycle. Only by sacrificing short-term volume for data integrity can operators validate that conversion lifts are genuine and sustainable.
Frequently Asked Questions
Eighty-one percent of teams lack a framework to verify business results. This gap means most organizations cannot distinguish between high content volume and actual revenue growth or brand damage.
Output volume increases by an average of seventy-seven percent within six months. This surge creates a critical need for performance baselines to ensure quality does not decline as quantity rises sharply.
Citation rate now serves as a primary indicator of trustworthiness over traditional scores. Relying on old volume signals fails because production speed no longer correlates with business success in generative search.
Platforms prioritize hook rate by measuring three-second views to determine asset success. If viewers do not stop scrolling immediately, the content fails to generate the engagement needed for downstream conversions.
Shifting from free manual tracking to paid integrated intelligence platforms represents a necessary investment. Without this upgrade, teams risk optimizing for false positives where content appears successful due to missing context.